Monitoring your system resources is quite common in tech world. But if you are a Linux or terminal person, then you know there is nothing stopping you from having tools at your disposal. I am going to show you a few of resource monitoring terminal tools in Linux today.
I am pretty sure you have heard or used top and htop for monitoring at some point. More advanced usage is covered for top and htop in another article linked below.
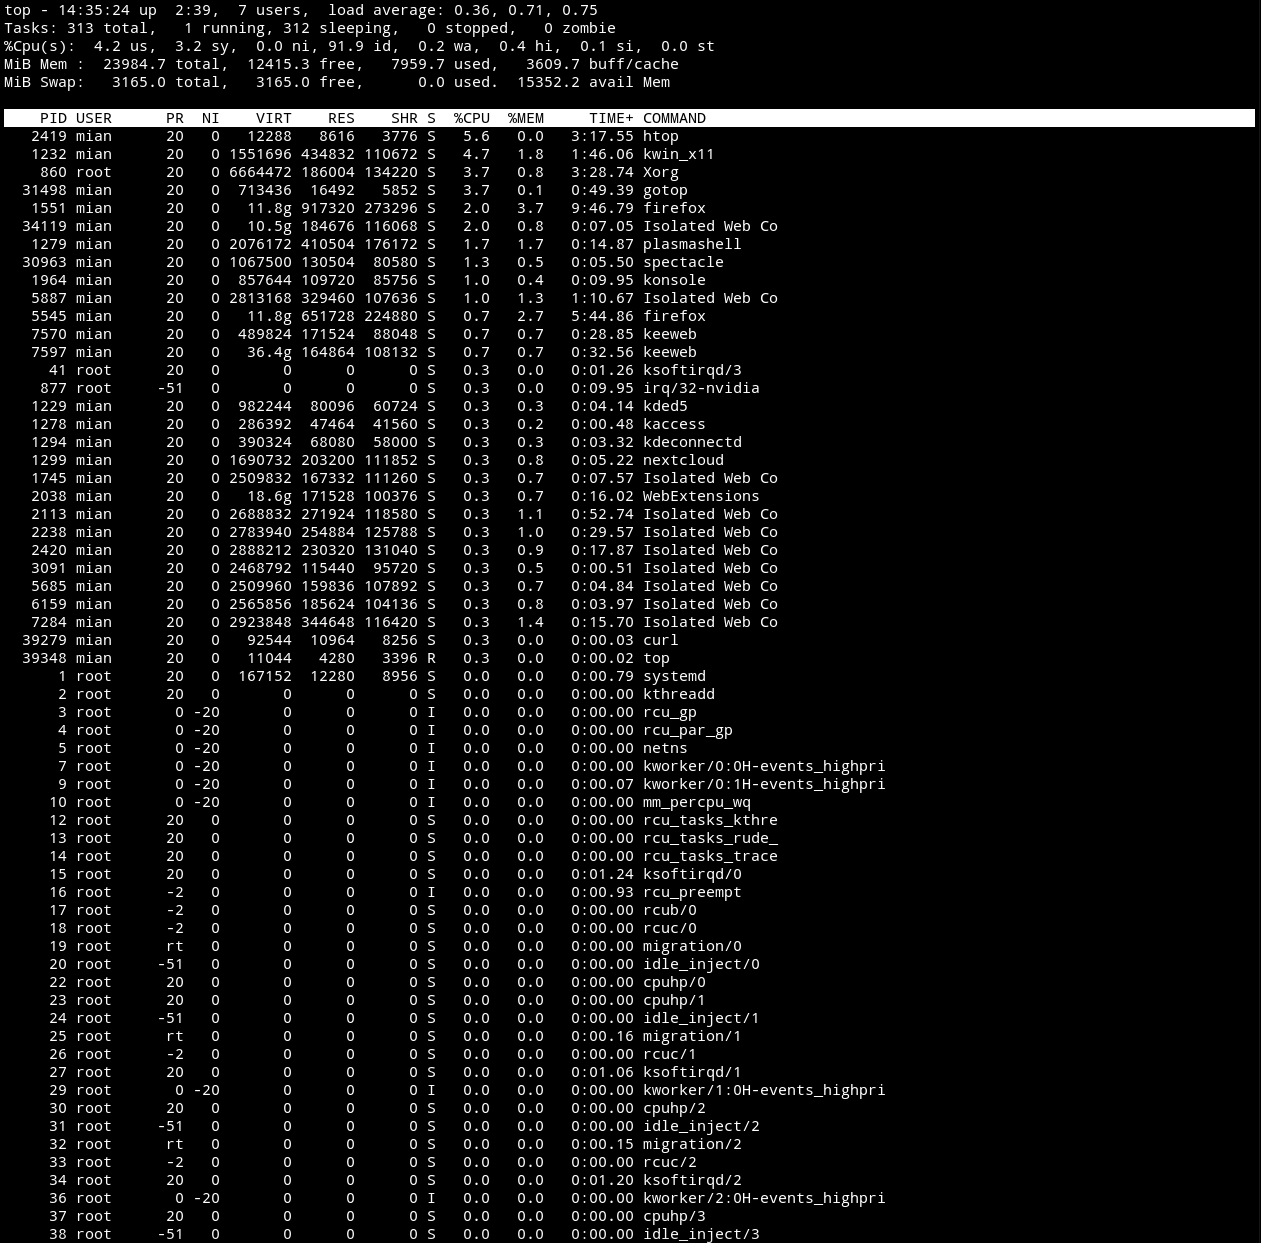
1- top
Once you install any Linux distribution, top comes pre-installed with it. It is a useful tool there is no doubt in that, but at times you may have wished to have a tool easy to understand.
2- htop
htop is the 2nd most common monitoring tool after top. It is more colorful and easy to understand compare to top. The CPU, memory and swap usage is shown in a linear graph.
Manjaro/Arch installation
sudo pacman -S htopUbuntu
sudo apt install htop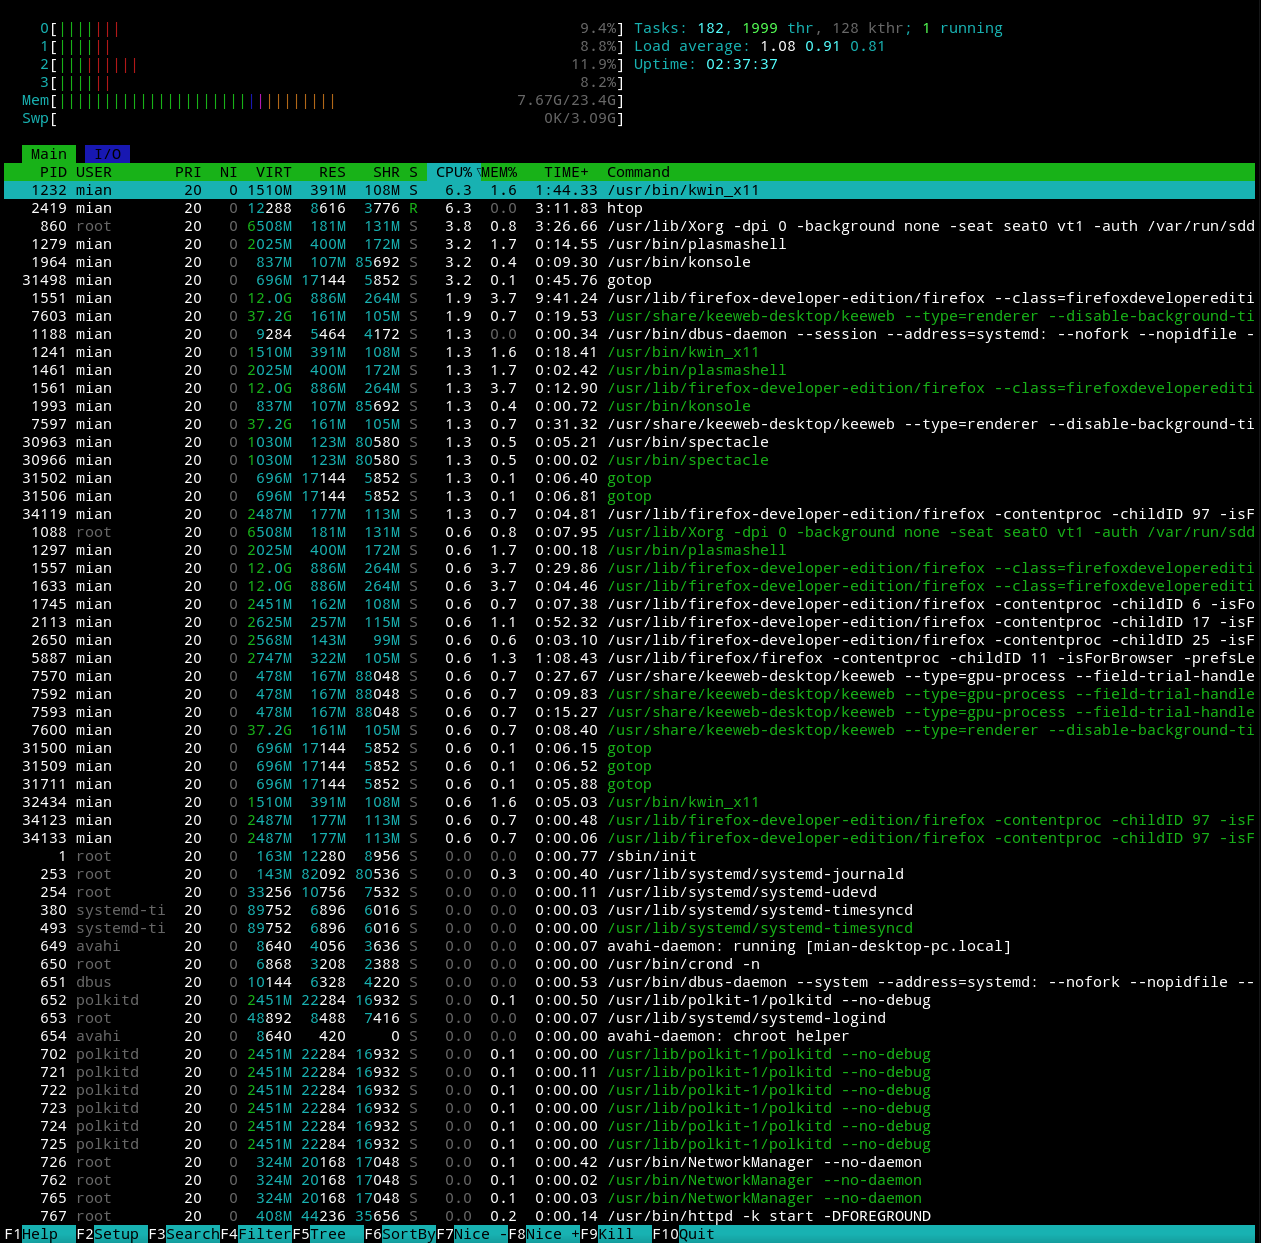
3- gotop
This is by far my favorite and daily driver for monitoring my system resources including network usage. It is not installed by default, so you have to install it first to use it. It is clean and the data presented is not coming in your way.
Manjaro/Arch
yay -S gotop-bin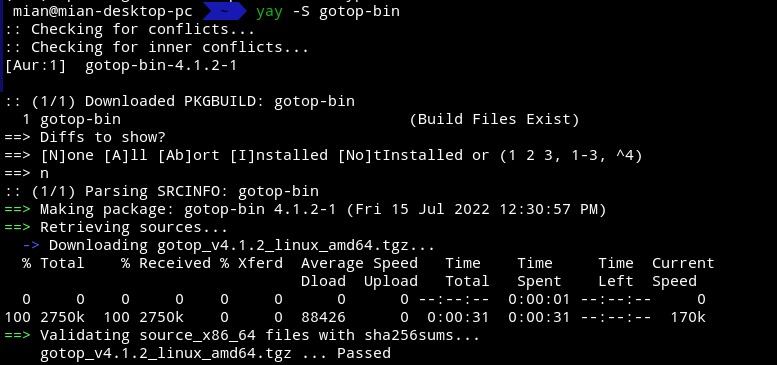
Ubuntu
For installing in Ubuntu, head over to the releases page and download a deb package. You can either install it by double clicking on it or in terminal with below command.
dpkg -i /path/to/gotop_v4.1.4_linux_arm6.deb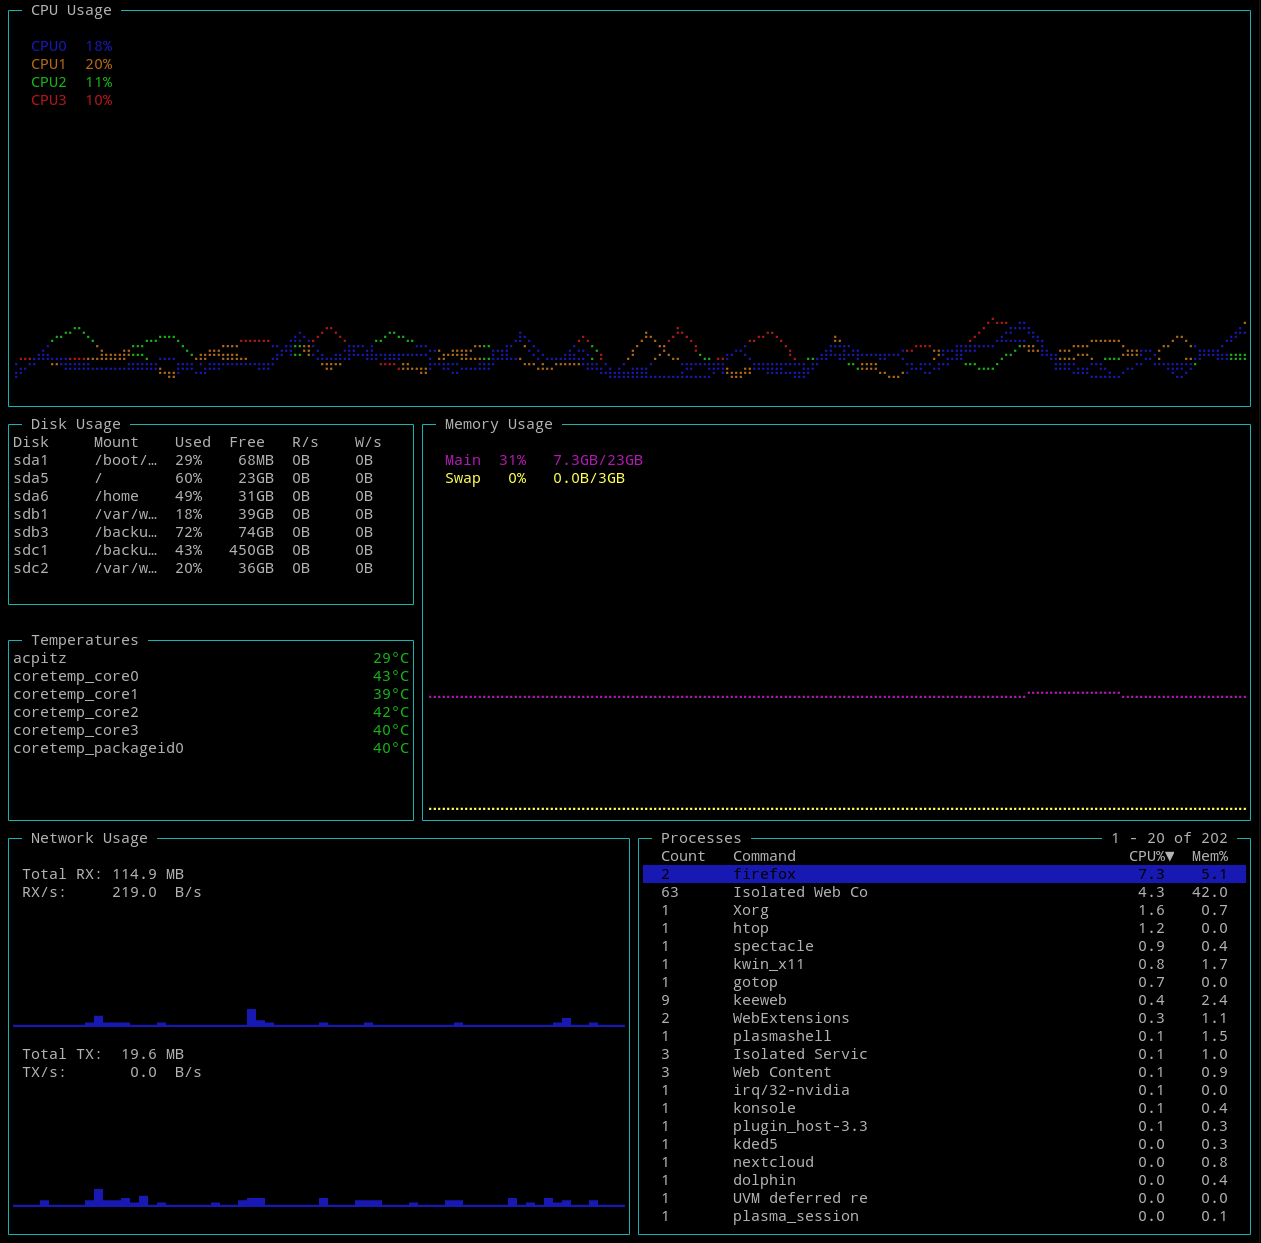
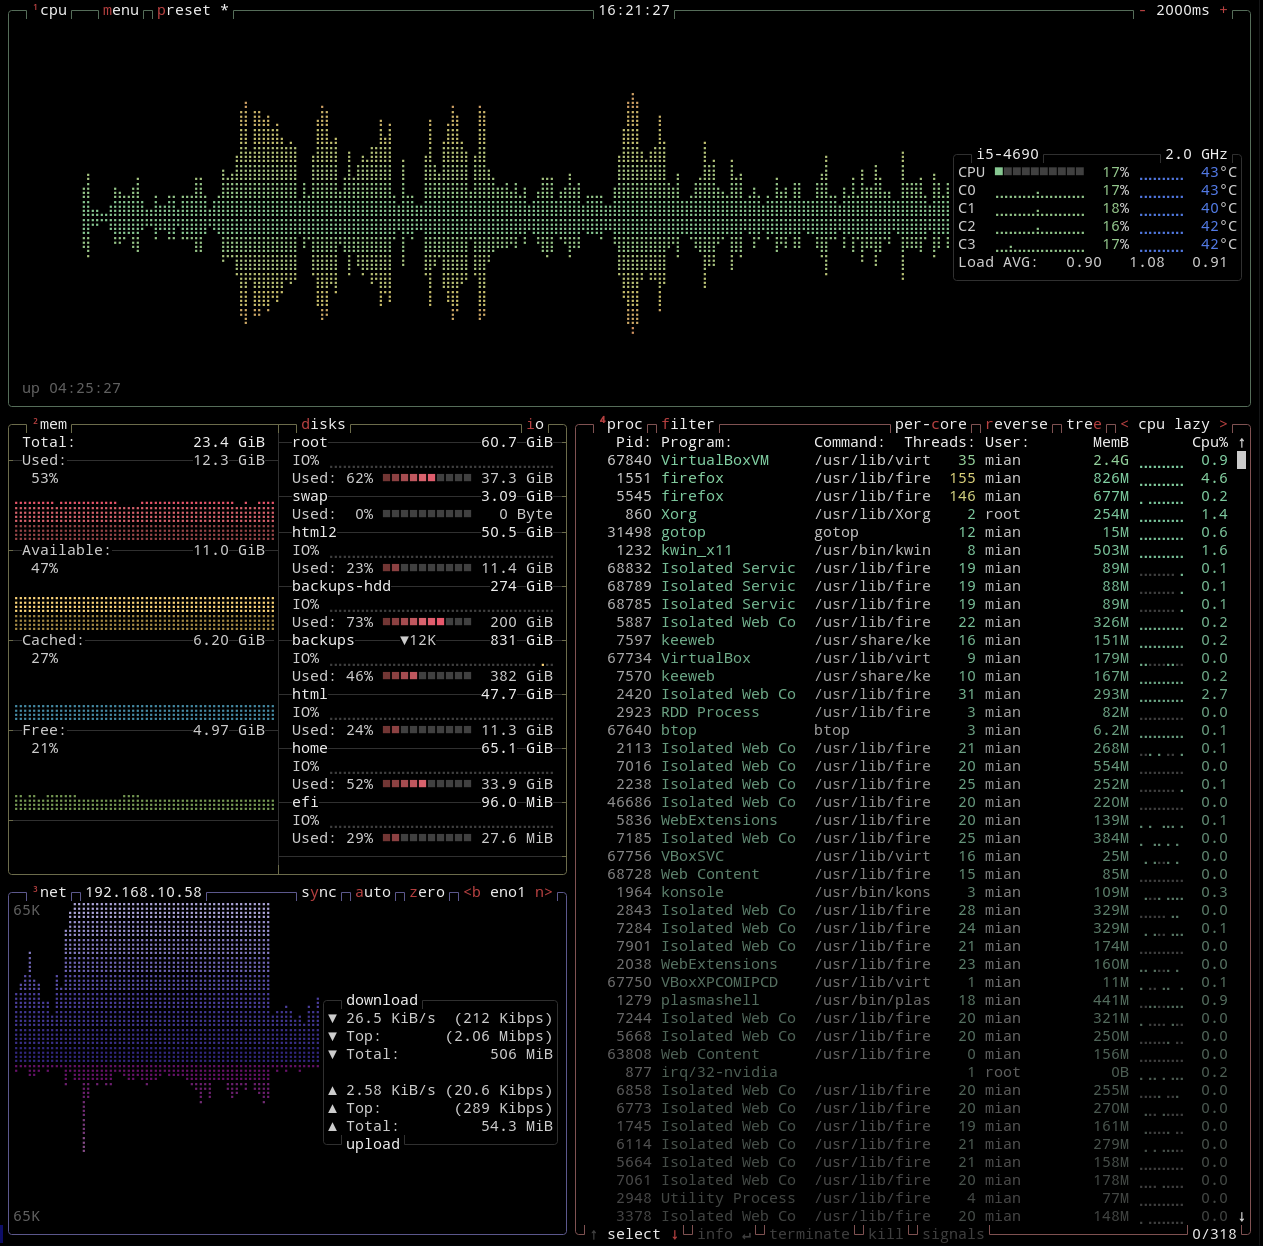
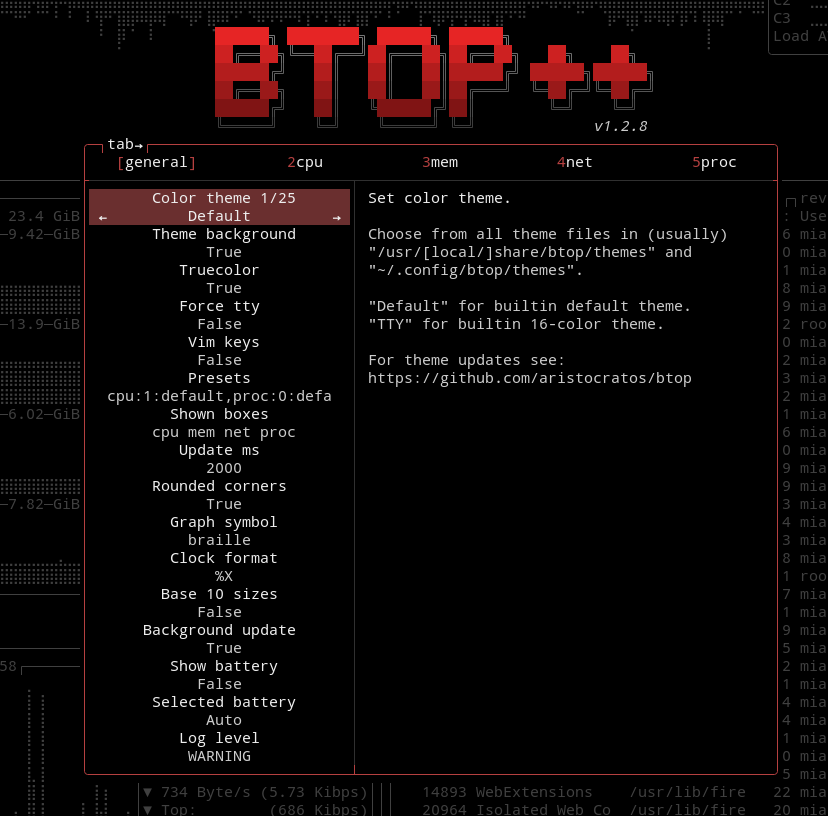
4- btop
btop is the most advanced and beautiful tool in all the listed tools here. It shows comprehensive data with graphs and you can easily change the layout to the way you want with presets. You can change theme, rounded corners on boxes, graph style, battery status on/off. Actually there are many options provided which you can tweak to fit your style and taste.
Manjaro/Arch
sudo pacman -S btop
Ubuntu
sudo snap install btop